Test Coverage vs Code Coverage: A Practical Guide
Compare test coverage vs code coverage: structural reach versus observed behavior, with a decision guide for unit, pull request, and release risk.
In this article
- Test Coverage vs Code Coverage at a Glance
- How to Read a Misleading Score
- What Each Metric Actually Counts
- Four Facts Hidden Inside One Percentage
- What the Matrix Changes in a Review
- Why a High Percentage Is Not a Release Gate
- Mutation Score Asks a Harder Question
- Teams Already Treat the Gate as Noise
- Which Metric Fits Each Stage of Delivery
- Matching the Signal to the Decision
- The Safety-Critical Exception
- Where High Code Coverage Still Misses Risk
- AI-Written Tests That Nobody Ran
- Mobile Launches on Hardware You Don't Own
- Weak Oracles Behind Strong Numbers
- How to Pair Both Metrics in One Report
- Keeping Execution and Verification Separate
- Choose the Metric for the Risk in Front of You
Code coverage measures which program structure ran during testing, while test coverage measures which intended behaviors and environments were checked. A high code coverage percentage is therefore not a release verdict, because code can execute without anyone observing whether the result was right.
That distinction sounds tidy until a build turns green. A dashboard shows strong line coverage, the pull request passes its check, and the team still doesn't know whether checkout worked on a budget Android phone, whether a failed payment recovered, or whether anyone asserted the saved record. The missing question isn't which percentage is bigger. It's which kind of evidence you have, structural reach, an oracle that observed an outcome, or execution in the environments your users run.
Test Coverage vs Code Coverage at a Glance
Teams publish one percentage as release confidence because the two terms sound interchangeable. They aren't. Code coverage is the share of program structure a suite executes, usually statements, branches, decisions, or conditions. Test coverage asks whether intended behaviors, requirements, user journeys, environments, and outcomes were exercised and checked.
| Criterion | Code coverage | Test coverage |
|---|---|---|
| What it counts | Statements, branches, decisions, or conditions executed | Requirements, journeys, risks, and environments exercised and checked |
| Unit of the score | Percent of structural elements hit | Cases or risks with a recorded outcome, often by environment |
| What a high score proves | The suite reached that structure | Those intended behaviors were run and an expected outcome was observed |
| What it does not prove | The result was correct or the assertion was meaningful | Every line was executed or every mutant would be killed |
| Characteristic blind spot | Dead code and untested branches inside the repo | Missing oracles, devices, browsers, networks, and recovery paths |
| Best decision it supports | Where to add tests for unreached implementation | Whether this build is evidenced for the risks you chose to cover |
How to Read a Misleading Score
Say a suite reports 90 percent structural coverage. That tells you the tests reached nine tenths of the measured structure. It doesn't tell you that assertions observed nine tenths of what that structure produced. If only about 56 percent of the executed structure is meaningfully observed, the dashboard and the evidence describe two different releases. One looks nearly complete. The other has a large body of code that ran without a check strong enough to catch a wrong return value, a broken UI state, or a corrupted record.
The gap widens once you leave the repository. Source instrumentation can mark a branch as hit, but it can't represent a phone model, an older operating system, Safari instead of Chrome, or a mobile network dropping mid-journey. Those aren't refinements of the code coverage number. They're a different dimension of test coverage vs code coverage, and they need their own rows in your evidence.
Practical rule: quote code coverage when you're hunting unreached implementation, and quote test coverage when you're deciding whether users are protected.
Neither number replaces the other, and averaging them into one blended score hides exactly the information a release review needs. What matters next is how that gap between execution and observation gets measured, why a fixed threshold can't close it, which signal fits each stage of delivery, and how to report both kinds of evidence side by side without collapsing them.
What Each Metric Actually Counts
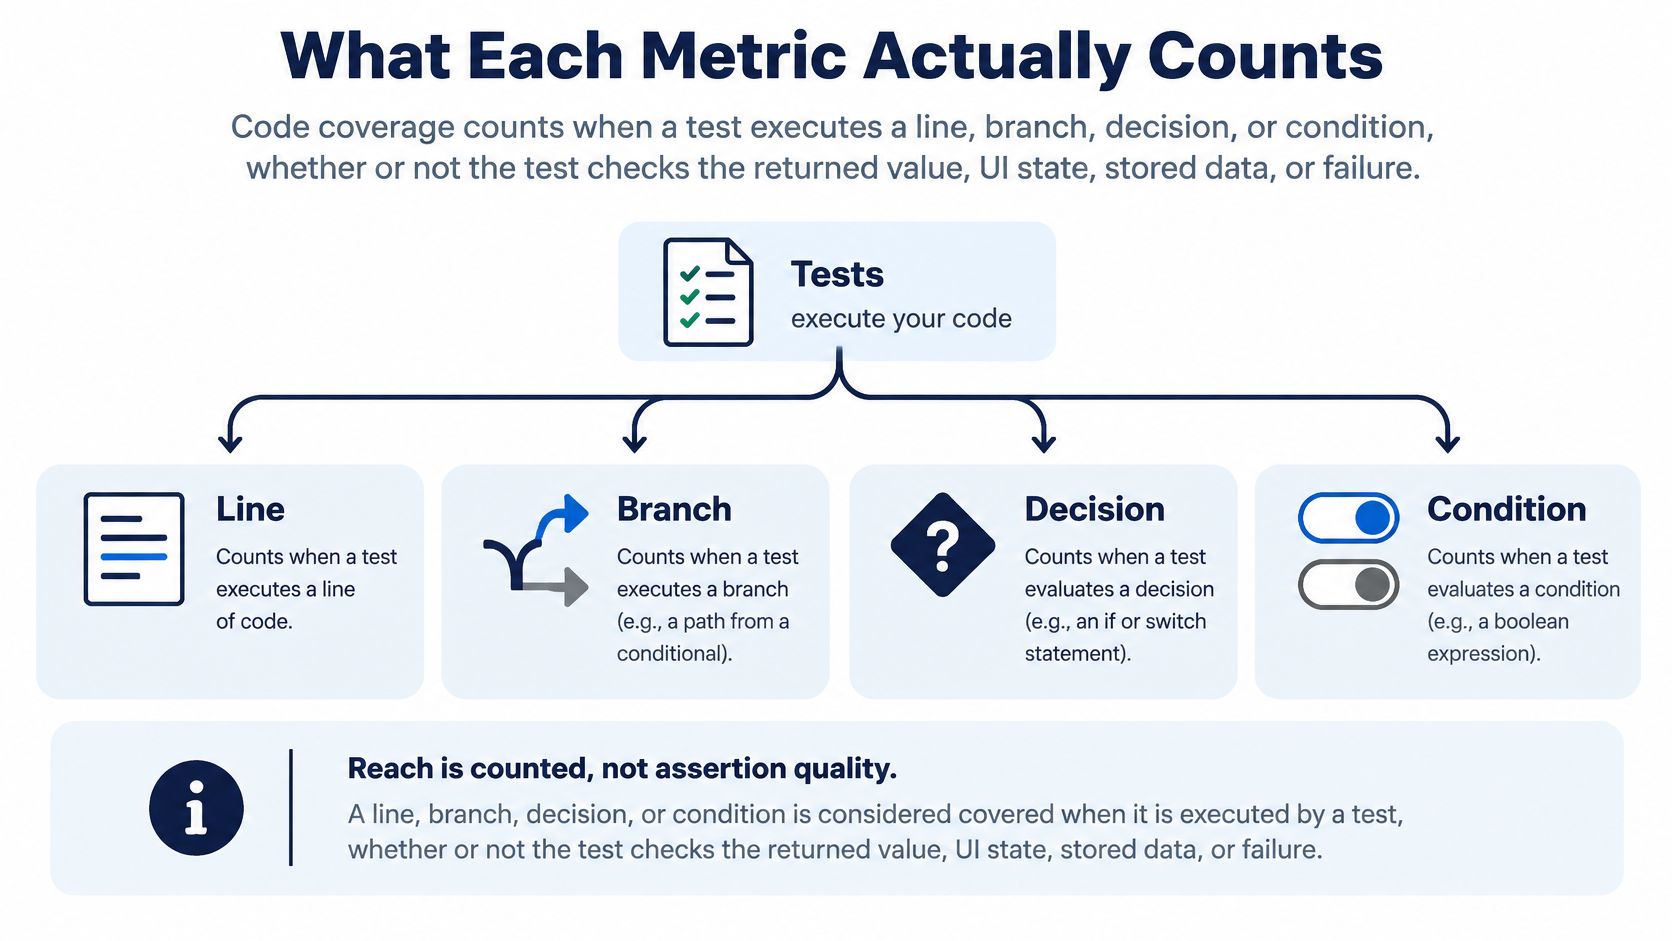
Code coverage counts reach. A line, branch, decision, or condition registers as covered when some test executes it. The counter doesn't ask whether that test checked the returned value, the state of the screen, the data written to storage, or what happened when the operation failed. A test that calls a function and asserts nothing still raises the percentage.
Test coverage counts observation. A requirement or journey is covered when someone exercised it against an expected outcome and recorded what happened. The ICSE study of 13 Java applications involving 16,000 test cases and 51,600 test assertions put a number on the distance between those two facts. Mature suites showed a structural coverage gap as high as 51 percentage points, with an average gap of 34 percentage points, where code executed but no test oracle observed or validated the resulting behavior.
Four Facts Hidden Inside One Percentage
A single dashboard number compresses at least four separate states, and only one of them is strong evidence.
- Generated but never run: the case exists in a file or a plan, and nothing executed it.
- Executed but not asserted: the code ran, the coverage tool counted it, and no check compared the outcome with what should have happened.
- Asserted on one path only: the happy path has a real oracle, while the negative, boundary, and recovery paths through the same code have none.
- Asserted in one environment only: the check passed on a single CI agent, one browser, or one emulator, and says nothing about the devices your users own.
That compression is why a release team needs a two-dimensional matrix instead of a score. Put each requirement or test case in a row. Record its status as passed, failed, blocked, or unrun. Then map those same cases onto the statements and branches they exercise. The matrix shows you things a percentage structurally cannot, such as a checkout flow tested five times through the same branch while its error handling has never been observed once.
What the Matrix Changes in a Review
Once you can see both axes, arguments get shorter. A reviewer no longer asks whether coverage is "high enough" in the abstract. She asks why a refund journey is marked unrun, why a permission branch executes in unit tests but has no assertion on the denial path, or why every passing case ran on one browser. Those are questions with owners and fixes.
Before your next release review, split the number you're quoting into its parts. Separate executed structure from checked outcomes, and list what's unrun by name. You'll likely find the percentage was never the problem. The problem was that it answered a narrower question than the one you were asking.
Why a High Percentage Is Not a Release Gate
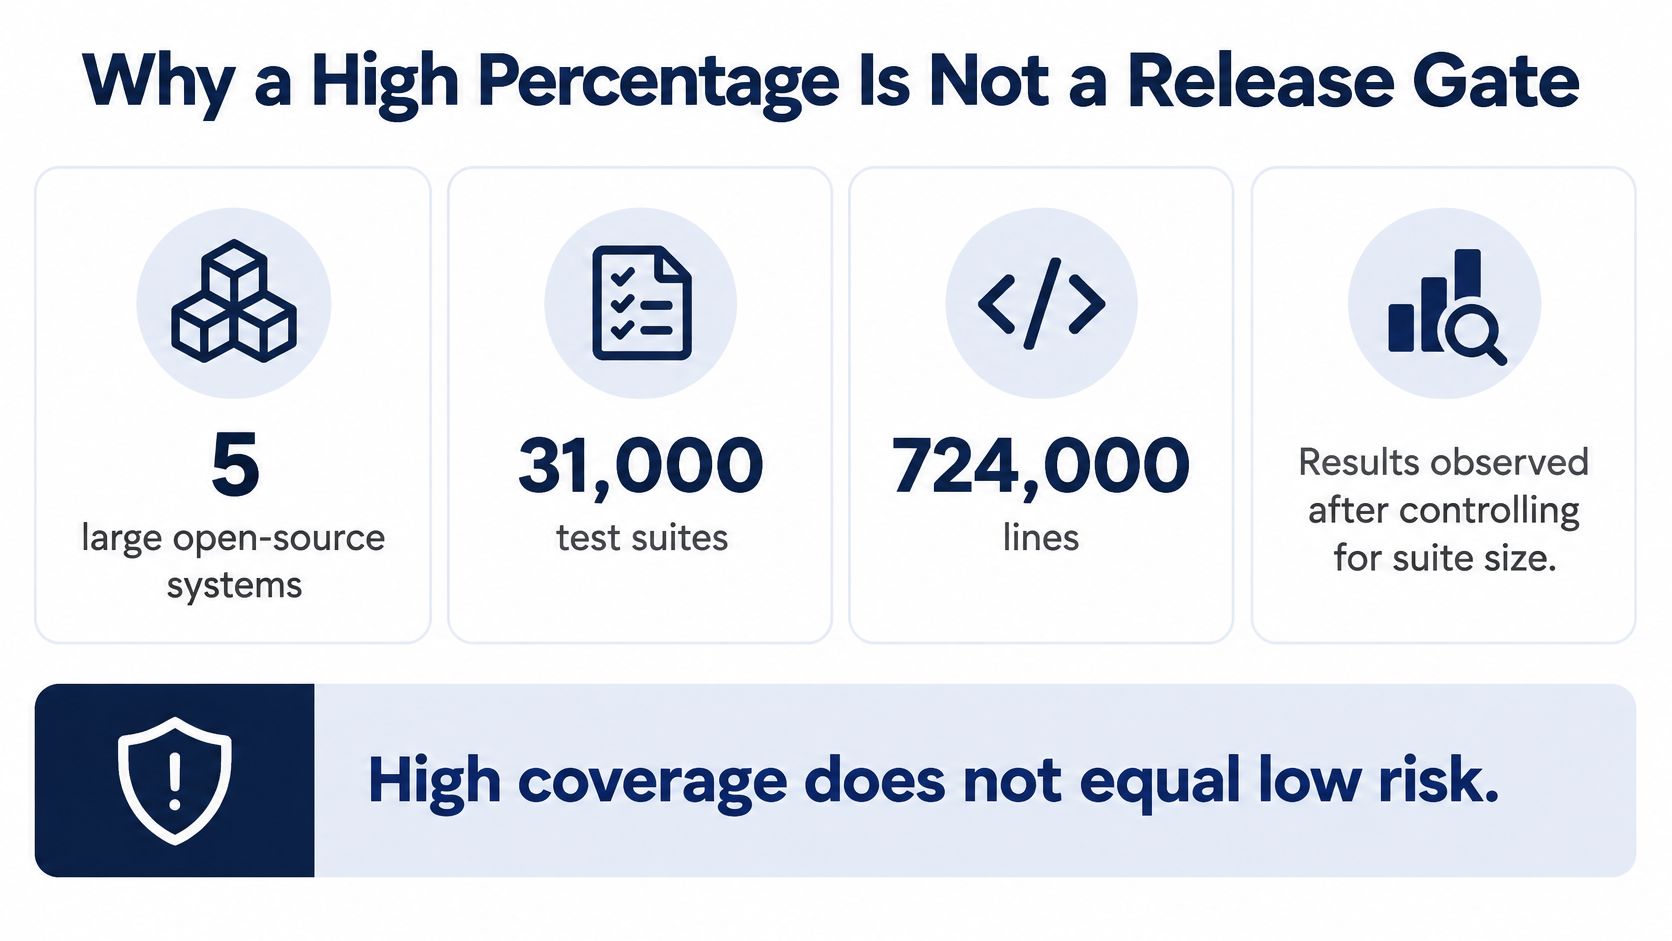
A fixed coverage bar promises something it can't deliver. Crossing a threshold suggests the suite would catch real faults, yet research comparing coverage levels against fault-finding effectiveness keeps reporting a weak and inconsistent relationship once suite size is accounted for. Stricter structural criteria don't reliably improve the picture, and the strength of the link varies from system to system.
Mutation Score Asks a Harder Question
Mutation testing asks whether your assertions can tell correct behavior from a plausible fault. The tool injects small defects, called mutants, and the score counts killed mutants relative to generated mutants, including survived and uncovered mutants. A surviving mutant is a concrete embarrassment, because the suite ran that code and still couldn't distinguish right from wrong.
The 2026 empirical study of LLM-generated test suites reported that correlations between common coverage measures and mutation scores were generally weak, with nearly all coefficients below 0.4 and the strongest pairing, average statement coverage versus normalized mutation score, reaching only 0.443. That's a thin bridge between the number teams gate on and the fault-detection property they want. Fast-built applications face the same gap, which is why Continuum Solutions on vibe-coded app risks belongs next to any green dashboard.
Mutation score has real limits, and pretending otherwise repeats the original mistake with a new number. It's computationally costly at repository scale. Equivalent mutants, injected changes that don't alter behavior, are hard to identify and drag the score down unfairly. An aggregate figure can also hide one badly tested change inside a healthy average. Guidance on validation of test results makes the related point that a result counts once someone has verified the outcome, which is a different event from a tool producing output.
Teams Already Treat the Gate as Noise
Engineers have already voted with their merges. In a 2024 Delft University of Technology study of 279 software engineers, more than 80% said they ignored failing code-coverage status checks at least sometimes. A gate that engineers step around stops working as a quality control. It becomes friction, and friction teaches people to write assertion-free tests that satisfy the counter.
There's also a structural reason the percentage can't gate a release. Instrumentation records which statements and branches executed. It cannot record whether an oracle checked the outcome, and it cannot see the device, browser, or network where the run happened. Those are separate facts, and the score only captures the first one.
Use statement and branch coverage to locate unexercised structure. Add mutation score on changed code when the runtime is affordable. Then keep both in their proper role: diagnostics that tell you where to look, standing in for cases run, environments covered, and outcomes verified by no one.
Which Metric Fits Each Stage of Delivery
No single metric wins the test coverage vs code coverage question across a full delivery cycle. Each stage poses a different question, and each question has a signal that answers it cheaply while the others answer it badly.
| Stage | Primary signal | Do not optimize | Evidence to keep |
|---|---|---|---|
| Early development | Statement and branch coverage on new modules | Whole-repo percentage | Unreached branches named for the next tests |
| Pull request | Changed-code coverage plus assertions on the diff | Legacy file averages | New decisions checked, including one negative or boundary case |
| Pre-release | Requirement, journey, device, browser, and network coverage | Another point of unit coverage | Passed, failed, blocked, and unrun cases by environment |
| After an incident | Oracle and environment that match the failure | A global threshold increase | A check that reaches the failed path and records the outcome |
| Safety-critical decisions | Statement, decision, and MC/DC where the standard requires it | Selective sampling of conditions | Each condition shown to change the decision alone |
Matching the Signal to the Decision
Early in development, cheap structural coverage earns its keep. The code is still malleable, and knowing that a new module's error branch has never executed is actionable the same afternoon. Chasing the last few points at this stage buys little, because the code will change again before release.
At pull-request review, the unit of interest shrinks to the diff. Changed-code coverage paired with behavioral checks on that change beats a whole-repository percentage, because a reviewer can point at one untested new branch and ask for one missing assertion. A structured approach like the one in our test plans example keeps that review tied to named cases rather than impressions.
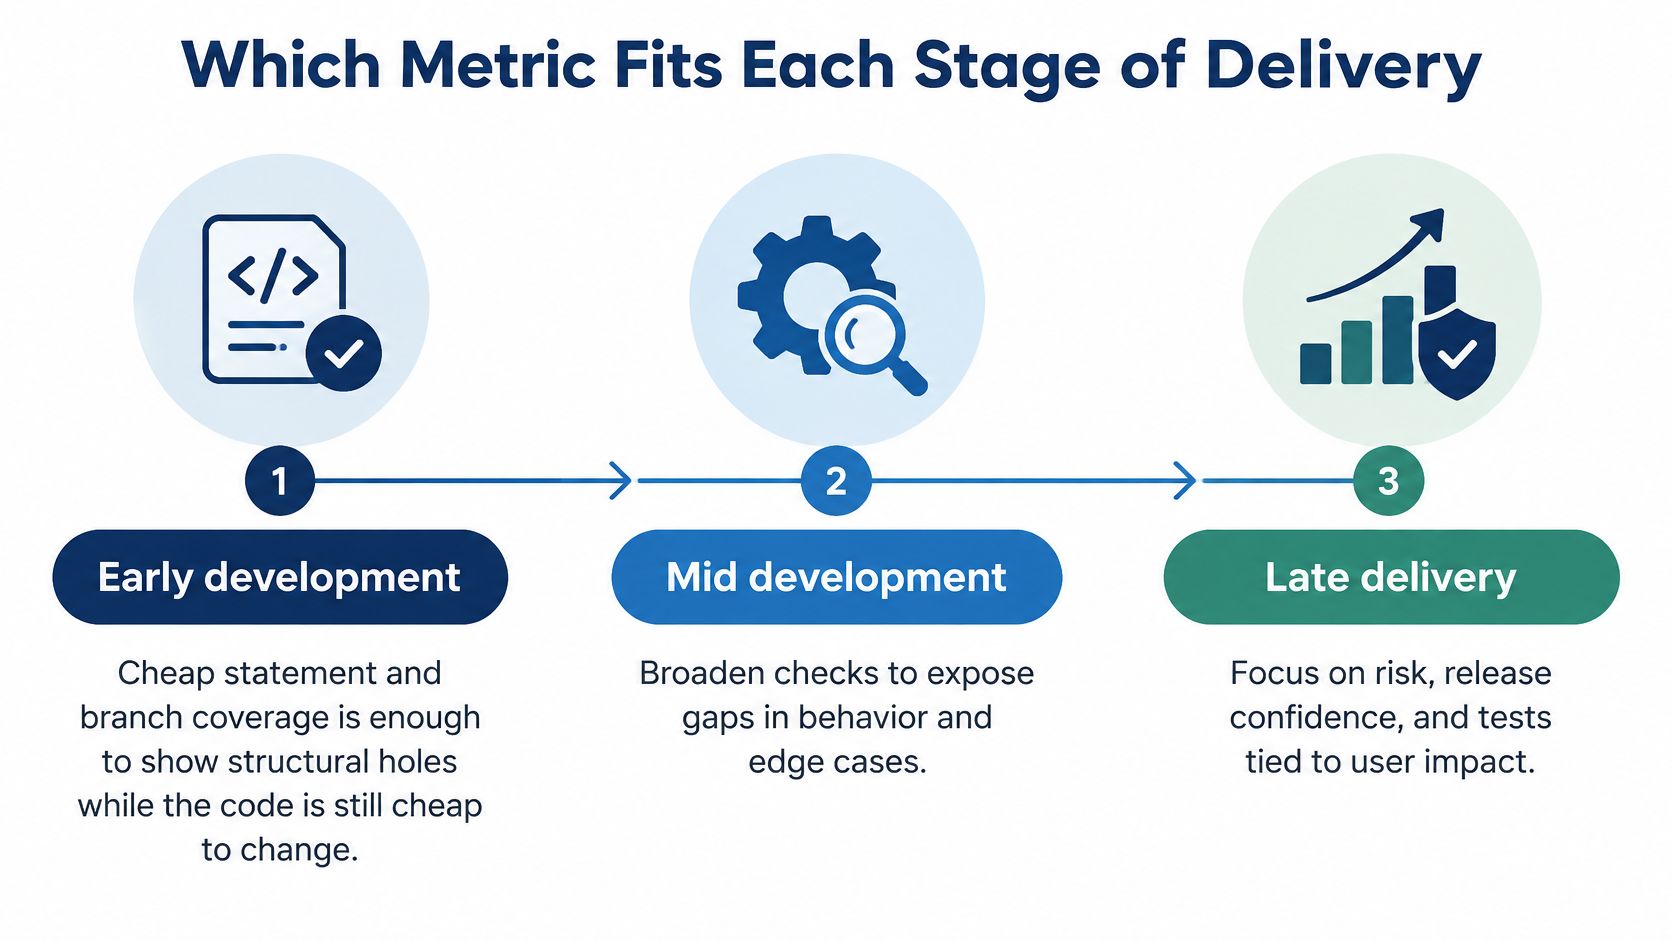
Pre-release is where the balance flips. What matters now is evidence that an oracle observed real outcomes: scenario, device, browser, network, and recovery-path results, each with a recorded verdict. Another point of unit coverage adds little, because instrumentation never runs on a low-memory handset, a dated operating system, or a connection dropping between cell towers. Structural reach got you here. Observed behavior gets you to release.
After an incident, the priority narrows again. Reproduce the environment that failed, write the check that would have caught the defect, and use coverage only to confirm the new check reaches the path that hurt you.
The Safety-Critical Exception
One row in the table operates under different rules. MC/DC asks whether each condition in a decision can independently change the outcome, and safety-critical software standards require that level of proof for the most critical decisions. The bar exists for systems where failure can injure or kill. An app team can borrow the underlying idea, that every condition inside a risky decision deserves its own check, without importing a blanket gate across the whole codebase.
The ICSE 2021 study of mutation testing practices supplies a broader caution here: coverage-adequate suites are neither normal nor necessarily desirable, and thresholds are arbitrary. Coverage and mutation scores also work better for regression-style comparisons than for discovering bugs already sitting in the code under test.
Pick the row that matches the decision in front of you. Maximizing every column at once buys numbers nobody reads.
Where High Code Coverage Still Misses Risk
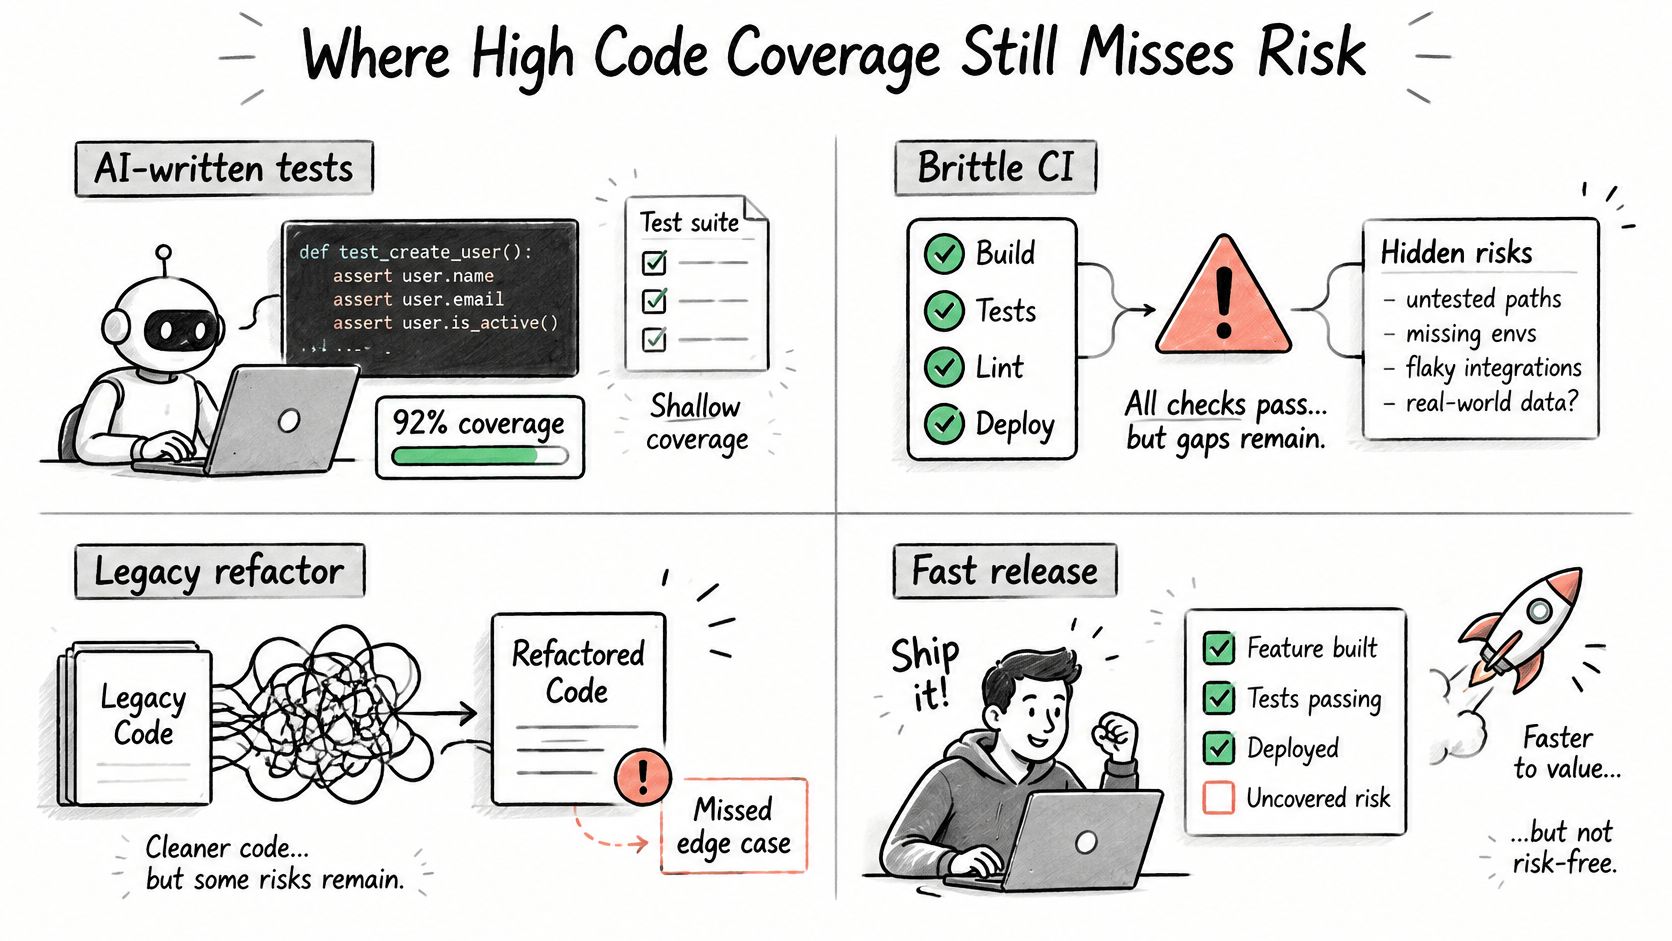
Four release situations expose the gap between a strong percentage and actual protection. Each one is common, and each one survives a green build.
AI-Written Tests That Nobody Ran
In the 2024 Stack Overflow survey, 27.2% of developers said they used AI for testing code, compared with 82% who used AI for writing code. Generation has outpaced execution. Teams now hold long lists of plausible cases that were never run on anything, and a case count gets quoted in reviews as if it were evidence.
It isn't. Generated is not run, and run is not checked. We parse uploaded test cases into a plan and show the coverage before testers start, which makes the unexecuted portion visible while there's still time to act on it. Writing test cases is not included in that work, and customers bring their own cases, AI-generated or otherwise. That separation is deliberate, because authoring cases and proving they pass on real hardware are different jobs.
Mobile Launches on Hardware You Don't Own
Say a unit suite covers every branch of a checkout flow. It still hasn't met a budget Android phone with limited memory, an older iOS version, or a local network that drops packets at the payment step. The useful record for that risk is each case against each device, marked pass, fail, blocked, or not run, with a reason recorded whenever a case didn't run. Our reports carry exactly that coverage table, showing every test case against every device as pass, fail, blocked, or not run, with a reason for blocked and not-run cases.
Desktop web carries the same trap in a different shape. Chrome on Windows doesn't stand in for Safari, Edge, or Firefox across macOS and ChromeOS when layout, storage behavior, or an authentication redirect differs by browser. A line of code rendering correctly in one engine tells you nothing about another.
Weak Oracles Behind Strong Numbers
The fourth gap is the quietest. A test hits a line and never asserts the returned value, the saved record, the empty state, or the recovery path after a failure. Exploratory work around the scripted cases is what surfaces those holes, because a person notices that the screen looks wrong even though nothing threw an error. In one crowd-testing engagement, that kind of execution found 147 valid bugs, which is the class of evidence a percentage can't substitute for.
When a build goes green, ask which of the four gaps is still open, unexecuted cases, untested devices, untested browsers, or unchecked outcomes.
How to Pair Both Metrics in One Report
A useful release report keeps the two metrics in separate columns and lets the reader see where one kind of evidence exists without the other. Build it in this order.
- List what's in scope: name the requirements or journeys this build claims to cover, not every line in the repository.
- Record status per case: mark each one passed, failed, blocked, or unrun, and require a written reason for blocked and unrun rows.
- Attach the environment: put the device or browser, operating system, and network conditions on the same row as the result.
- State the oracle: write down the assertion or observable outcome that was checked, not merely the fact that code executed.
- Add structural coverage selectively: report statement and branch percentages for changed or risky modules, and name the unreached paths.
- Add mutation score where it's affordable: run it on the diff when runtime cost is acceptable, and say plainly what wasn't mutated.
- Write the residual-risk note: list the cases left unrun and the environments left uncovered, in the report, where a decision-maker will read them.
| Evidence | From code coverage | From test coverage | Risk if missing |
|---|---|---|---|
| Reach | Statements and branches executed | Cases actually started | Untested implementation looks finished |
| Oracle | None; execution is not a check | Expected versus actual outcome | Bugs in covered lines ship unseen |
| Environment | Usually one CI agent | Device, browser, OS, network | Lab-only passes hide field failures |
| Status | Hit or not hit | Passed, failed, blocked, unrun with a reason | Skipped cases inflate confidence |
| Change focus | Coverage on the diff | Journeys touching the change | Repo-wide averages hide the patch |
| Residual risk | Unreached paths named | Unrun cases and uncovered environments listed | The next build repeats the same gap |
Keeping Execution and Verification Separate
A complete report of this kind contains a coverage table, reproducible findings, a verification record, a device and browser matrix, a session log, and a coverage note. Ours is structured that way, and the format in our software testing report template follows the same logic. The point of the structure is separation. Execution produces raw results, and verification merges duplicates and grades severity against a rubric before any number gets treated as fact. Findings should arrive with reproduction steps and media, so an engineer can act without a follow-up meeting.
Mutation testing belongs in this report as a supplement, not a substitute. It can reveal missing checks that structural coverage hides, but it's expensive at scale and produces equivalent or low-value mutants that someone has to triage. It also says nothing about whether the app survived a real phone.
For the next build, rerun the same plan and diff the matrix. A case that moved from unrun to passed on three new devices is progress you can defend. A percentage that crept up by two points is mostly a mood.
Choose the Metric for the Risk in Front of You
Start by naming the exposure this build carries. If the worry is code the suite never reaches, statement and branch coverage show the structural gap, and new tests belong only on unreached paths with meaningful risk. If the worry is merge safety, changed-code coverage plus assertions on the diff is the sharper instrument. If the worry is release behavior on the phones and browsers customers use, the stronger evidence is an oracle that observed outcomes: each case against each target, marked pass, fail, blocked, or not run.
The split is structural reach versus observed result. An executed line proves the path ran; a passing case proves a requirement held under a stated environment. A blocked or unrun row is also evidence because it marks exactly where confidence stops.
Capacity often decides whether gaps close. Some teams hire developers from latin america to expand test authorship, yet more cases still leave execution unresolved until they run on selected targets. When cases already exist, including AI-generated ones, upload should expose which cases the current plan leaves uncovered; you can add five sessions at a time, or leave them and let the report list them as not run. Fixed package pricing and session credits keep that choice bounded, while reruns against the next build show whether the same hole persists.
One limit stays explicit. No testing package finds every defect, and 99tests is not liable for bugs testing did not surface, which is why residual risk belongs on the report instead of being rounded away. Pick the risk in front of this build, collect matching evidence, and refuse to ship on a single coverage KPI.
If your test cases exist but remain unexecuted on the devices and browsers your users run, 99tests can parse uploaded cases, show coverage before testers start, and return a case-by-device table with pass, fail, blocked, and not-run results plus reproducible findings.