Testing on Mobile App Builds: Devices, Networks, Reports
Learn how to test on mobile app builds across real devices, live networks, privacy, and accessibility, with clear reports your developers can act on fast.
In this article
- Why Platform Share Sets Your Test Plan
- Real Devices, Emulators and Cloud Farms Compared
- Device Matrix to Cover Before Each Release
- Speed and Network Checks That Predict Drop-off
- Four numbers, measured separately
- How to Run a Functional Pass on Real Devices
- Privacy and Accessibility Journeys Teams Miss
- Accessibility breaks at the journey level
- Privacy failures are usability failures
- Reports That Turn Failures Into Fixes
- Confirm Your Device Plan Before You Ship
The average cost of a mobile app security breach reached $6.99 million in 2025, according to an Enterprise Strategy Group study commissioned by Guardsquare. That number isn't the price of a missing phone model. It's the price of shipping behaviour nobody checked, in the hands of real users on real networks.
Most release arguments are about counts. How many devices, how many emulator profiles, how many cases executed. The count tells you nothing about risk. What decides whether a build is safe is whether every target you chose produced a recorded result on a real device and a real network, running the whole journey rather than a screen.
That's the standard to hold. Emulators narrow the field, real phones and real networks produce the evidence, and the report either shows coverage per device or it doesn't count.
Why Platform Share Sets Your Test Plan
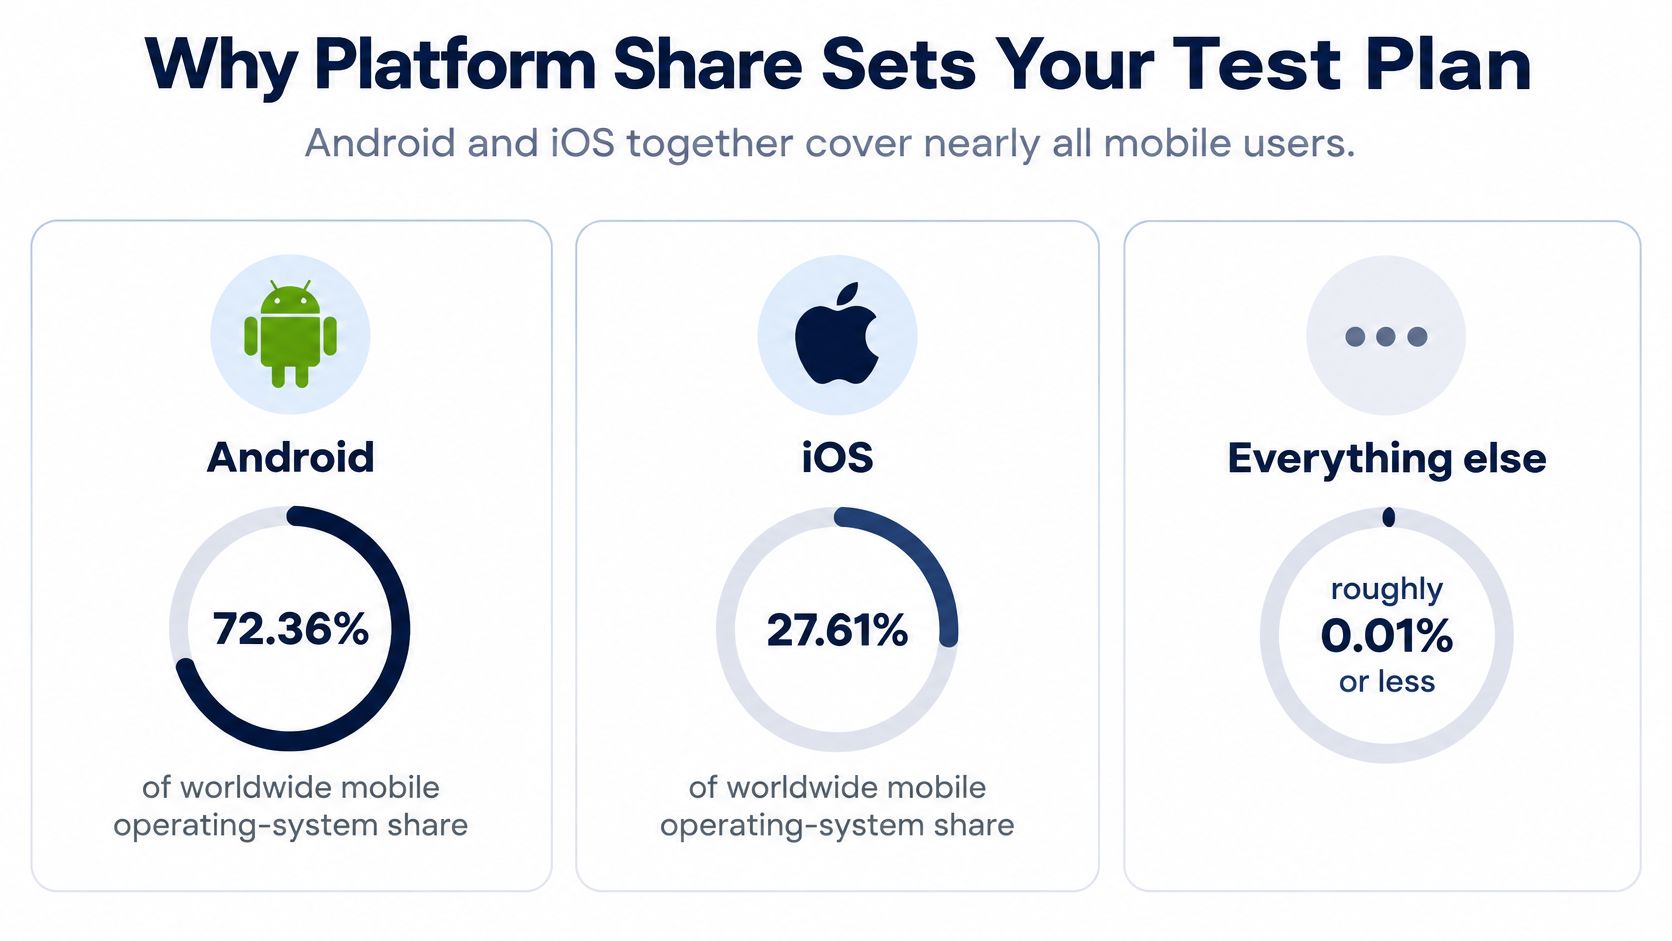
Android carries 72.36% of worldwide mobile operating-system share and iOS carries 27.61%, while Linux, KaiOS, Windows and Samsung each sit at roughly 0.01% or less, per StatCounter's worldwide mobile OS market share data. Two platforms account for almost the entire measurable market. That leaves no defensible reason to test one and skip the other.
Testing Android alone would omit at least 27.61% of worldwide share. Testing iOS alone would leave the majority Android audience unrepresented. The second mistake is the more common one on teams that develop on Macs and borrow a single Android phone at the end.
The two platforms fail differently, so they don't need the same plan.
- Android is a fragmentation problem. Coverage has to stretch across manufacturers, screen sizes, operating-system versions, processor types, memory configurations and network conditions. No single Android phone represents the platform.
- iOS is a support-matrix problem. Apple controls the hardware and the OS, so the work is validating the specific device and version combinations it still supports, including older iPhones that stay in use long after launch.
A release is a bridge. You check it for the traffic it will carry, not for an empty road.
Global share is a starting point, not an answer. Refine it with your target countries, audience, device tiers and OS versions. A product built for Indian smartphone users skews hard toward budget Android. A product sold to US enterprise buyers skews toward recent iPhones. The plan follows the audience, not the worldwide average.
Before choosing a single phone, write down two numbers: the Android share and the iOS share of your own user base. Then decide which device tiers each platform needs. Everything else in the matrix hangs off that decision.
Real Devices, Emulators and Cloud Farms Compared
Before a matrix means anything, each row needs an environment. The three options differ less in quality than in what they can see.
| Environment | Catches | Misses | Use when |
|---|---|---|---|
| Emulator or simulator | Layout logic, API contracts, early crashes | Real CPU and RAM limits, manufacturer skins, real radio behaviour | Early builds and CI smoke runs |
| Owned real phones | Real hardware, OS builds, real network conditions | Limited device count and OS spread | Matrix rows and release sign-off |
| Cloud device farm | Many models and OS versions quickly | Queue time and limited control of the physical network | Filling matrix gaps the owned devices cannot cover |
An emulator is a fast filter. It's the right place to catch a first-launch crash, a broken layout at a large font size, or a failed API contract, because it runs in seconds and costs nothing per run. What it can't do is tell you how the app behaves when a budget phone has 3 GB of RAM, a manufacturer skin kills a background service, or the radio drops from Wi-Fi to a weak cellular signal.
Owned phones carry the weight. They're the only place where hardware, OS build and real network conditions exist at once, which is why the rows that decide sign-off belong there. The constraint is the count. Many teams can justify a handful of devices, not a shelf.
Cloud farms solve breadth, not depth. You get many models and OS versions quickly, at the cost of queue time and limited control over the physical network. That second limit bites hardest on the tests that matter most for mobile app releases: handover, packet loss and recovery.
Assign every matrix row to one environment before testing starts, in writing. Then run the same journey on a real phone before you mark that row as passed. For teams on a two-week cadence, the questions behind release confidence for frequent mobile releases are the same ones this table answers: what evidence does each release need, and which environment can produce it.
Device Matrix to Cover Before Each Release
The matrix is the planning artifact, not a spreadsheet afterthought. One row is one coverage target: an example device, the version to cover, and the network to test on.
Random device sampling burns budget without buying coverage. An analysis of 645 Android apps found the median optimal SDK set was 2.5 versions, and 68.92% of apps carried SDK-version constraints, per a Wiley study of Android SDK and device coverage. The same research found that for 36 of 46 benchmark apps, testing at most seven of 14 SDK versions reached nearly the same code coverage as testing all fourteen, 33.13% versus 34.65%. Seven chosen targets bought almost everything fourteen did.
| Target | Example devices | Version to cover | Network to test |
|---|---|---|---|
| Budget Android | Redmi or entry-level Samsung, 3 to 4 GB RAM | Oldest Android version still in use | Congested 4G and throttled 3G |
| Mid-range Android | Mid-tier Samsung or Redmi | Current and previous major Android version | 4G, plus one pass on Wi-Fi |
| Flagship Android | Latest Samsung Galaxy flagship | Latest Android version | Wi-Fi and 5G |
| Older iPhone | iPhone 11 | Oldest iOS version the app supports | 4G |
| Current iPhone | Latest iPhone | Latest iOS version | Wi-Fi and 5G |
| Chrome on Windows | Windows laptop | Latest Chrome | Wi-Fi |
| Safari on Mac | MacBook | Latest Safari | Wi-Fi |
Treat those examples as placeholders. Pull the top devices from your own analytics, then keep the shape of the matrix: one oldest supported version, one current, one previous major, one budget tier, one mid-range, one flagship, one older iPhone.
Then add rows for the features the app depends on. Check the manifest, native libraries, permissions, camera, biometrics, notification handling, and background execution, because those are where a device-specific failure hides. On one manufacturer's battery optimisation, the push notification never arrives. No emulator will tell you that.
Browser and OS targets sit beside phone targets when your flows touch the web. We test on Redmi, Samsung and iPhone phones and on Chrome and Safari, across Android, iOS and Windows, and targets can be set by browser and OS as well as by phone, with sessions matched to testers who own those exact machines.
Choosing the rows is a judgment call worth slowing down for, and five parameters for choosing devices for mobile app testing is a reasonable frame. Fill the matrix from analytics plus the budget tier, and leave no row without an owner.
Speed and Network Checks That Predict Drop-off
Speed is a retention variable, not a usability nicety. A University of Helsinki study of mobile app performance found that both latency and energy consumption significantly reduce mobile-app retention, with the effect remaining broadly stable across application categories (Tortoise or Hare, quantifying the effects of performance on mobile app retention).
That changes what you measure. A single average load time is the least useful number on the dashboard, because it hides the tail that real users spend their time in.
Four numbers, measured separately
- Cold start: first launch from a terminated state, on the slowest device in the matrix.
- Screen-transition time: the delay between a tap and the next screen being usable, not merely painted.
- API response time: captured at the client, so it includes transport rather than server processing alone.
- Battery impact: a ten-minute session on a budget phone while the app runs its heaviest flow.
Acceptance criteria should use percentile measurements, p50 and p95 latency, because the slow tail is what someone on a two-year-old handset experiences.
Set the target at p95. An average hides precisely the users who abandon.
Scenarios matter as much as numbers: cold cache, warm cache, offline, high latency, packet loss and connection recovery. Segment every result by device class, OS version, network type and user flow. Say a payment completes in two seconds on a flagship over Wi-Fi. On a budget Android phone on a congested cellular connection, the same flow stalls, and the commercial outcome is different even though the code is identical.
Timestamps turn a complaint into a diagnosis. Record the user action, request initiation, server response, rendering completion, and any timeout or retry. With those points on a timeline you can separate a client rendering bottleneck from an API, transport or backend delay, and route the fix to the team that owns it.
Prioritise the flows that pay for the app: onboarding, login, checkout, payment. A slow settings screen costs patience. A slow payment screen costs revenue.
Our testers run your cases on their own Android phones, iPhones and laptops, on Jio, Airtel and Vi, so a congested cellular result gets recorded rather than simulated. Pick three retention-critical flows and set a p95 target for each this week.
How to Run a Functional Pass on Real Devices
A functional pass on real hardware is the only evidence that survives a release argument. Emulators still earn their place earlier, narrowing a build down to the flows worth checking on phones, but the pass itself happens on the devices your users hold. The order of operations matters almost as much as the cases.
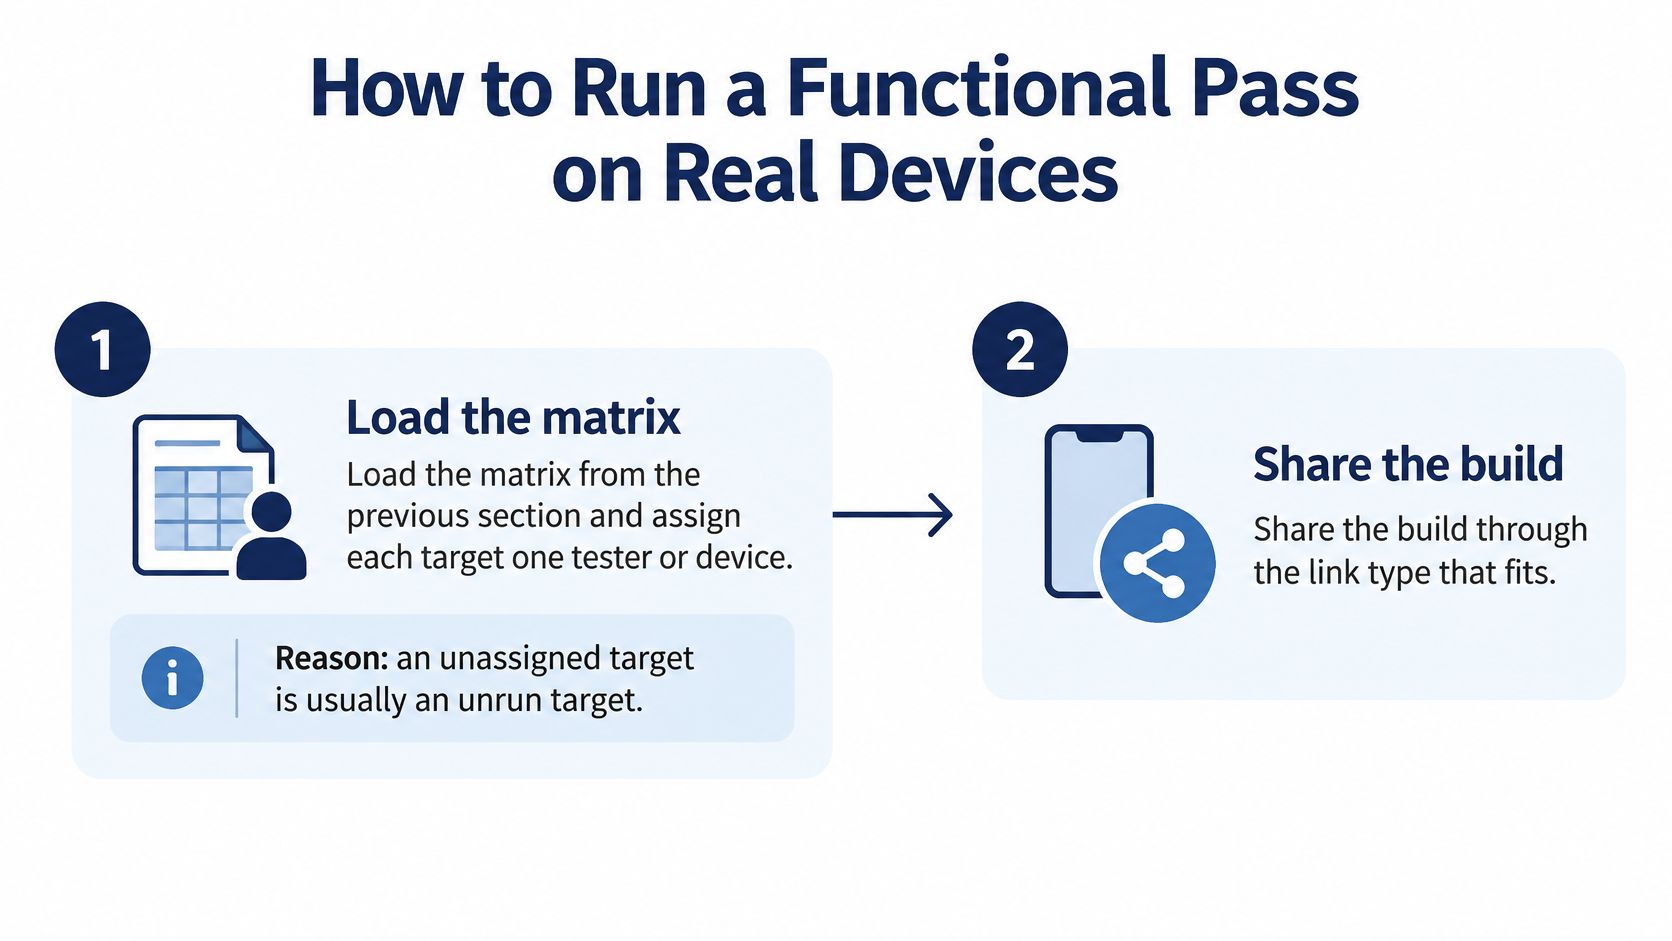
- Load the matrix and give every row an owner. One tester or device per target, named before the session starts. An unassigned target is usually an unrun target.
- Share the build through the link the platform expects. An APK download link or Google Play internal testing link for Android, a TestFlight public link for iOS, a staging or production URL for web. The slip that ruins the pass is testing a debug build that differs from what ships.
- Install and sign in from a clean state. Note the app version and the OS build on each device before the first case runs, because many "it works on mine" disputes trace back to a mismatched build or OS version. For the iOS side, testing iOS apps on real devices covers the provisioning and link handling.
- Run the cases in journey order. First launch, permission prompts, the core task, then exit and resume. Many failures appear only after a permission is granted or denied mid-journey, which is why screen-by-screen scripts miss them. The whole journey is the unit of evidence here, never the individual screen.
- Re-run the top three cases after a network switch and after backgrounding the app for several minutes. Resume bugs and silent retries live here. They never show up in a continuous session on good Wi-Fi.
- Mark every case passed, failed, blocked or unrun, and write the reason for anything that didn't run. A missing device, an OTP wall and an expired test account are all legitimate reasons. They're only legitimate if someone records them, because case-by-device results are what let a release manager see actual coverage.
- Repeat the same matrix on the next build. Same devices, same networks, same cases, so the comparison is like for like instead of a new sample.
A full matrix pass takes one tester the better part of a day, which is why release teams compress it onto the one phone on the desk. A crowdsourced run removes that trade-off: the rows run in parallel on testers' own phones and networks, and results come back on a fixed reporting schedule. The compression moves from coverage to calendar time.
Judge the pass by recorded coverage. An aggregate percentage hides gaps. A high pass rate built on unrun rows and a blocked payment journey is a release risk wearing a good number. The pass is complete when every matrix row has a recorded result and the journeys that carry revenue ran end to end on hardware your users hold.
Privacy and Accessibility Journeys Teams Miss
Component checks flatter an app. A screen can pass a label audit and still leave a screen-reader user stranded two steps later, with no error and no complaint filed.
A 2025 assessment of 50 popular iOS and Android apps across food delivery, payments, fitness, shopping and streaming found that 72% of user journeys contained Poor or Failing accessibility experiences, according to ArcTouch's state of mobile app accessibility. Only two apps earned a Great rating, and nine were classified as Failing.
Accessibility breaks at the journey level
The causes are the ones a checklist skips: broken navigation order, inaccessible authentication, missing captions, poor text scaling, gestures without alternatives, orientation restrictions. Layout and navigation problems and missing captions or transcripts are among the barriers people with disabilities report most often, so test those points explicitly on each journey.
Run whole tasks with the screen reader on, on real devices: sign-up, checkout, payment recovery, account cancellation. Emulators and scanners narrow the field by flagging which screens fail an audit, but they cannot tell you where a TalkBack user stalls. The release evidence is device-specific: which step blocks the journey, which assistive technology was in use, and whether the failure reproduces on the other OS.
Privacy failures are usability failures
A typical privacy pass summarises the policy and never touches the product's behaviour. An analysis of approximately 440,000 privacy-related app reviews across all 29 app categories found recurring concerns about unnecessary permissions, personal-information collection, frustrating privacy controls, tracking and the sale of personal data, per the ACM study of privacy-related app reviews.
Run privacy as a journey rather than a permissions list.
- First launch: what is requested, when, and whether the reason is visible before the system dialog appears.
- Deny, then revoke later: the app should degrade gracefully at both points, not only on the second launch.
- Login recovery and location or contact access: the flows where people grant access they don't understand.
- Analytics opt-out and data export: confirm the setting survives a restart and stops the calls.
- Account deletion and reinstall: the account should be gone, and a reinstall shouldn't resurrect it.
Pick two journeys from this list and add them to the matrix as rows with devices attached. A journey with no device assigned is a wish.
Reports That Turn Failures Into Fixes
"Login fails. Please fix." That report costs more than the bug. A developer spends a day reproducing on the wrong phone, the wrong network and the wrong build, then closes it as not reproducible, and the failure ships anyway.
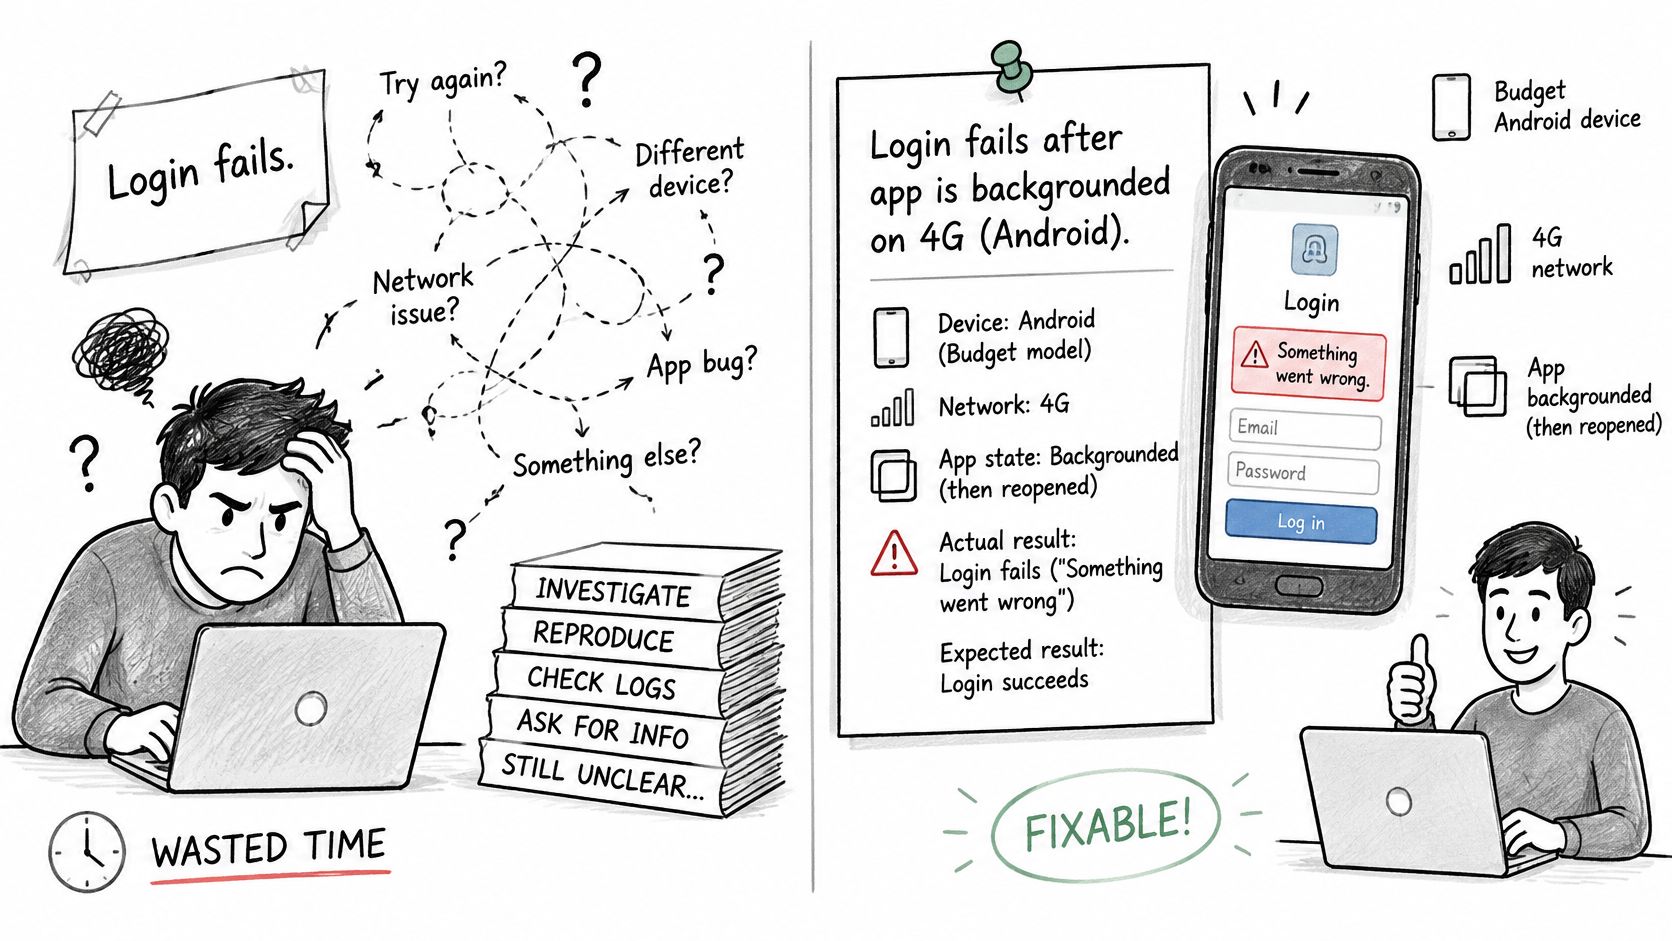
A fixable report reads differently. Say a session on a budget Android phone shows the login dropped after backgrounding. The report names the model and OS build, the app version, the network state and carrier, the numbered steps from a signed-out start, the expected resumed session against the actual spinner-then-login-screen, three reproductions out of three, and a screen recording.
Every defect needs the same fields:
- Device model and OS build, not just "Android".
- App version and build number, matching what the tester installed.
- Network state, naming carrier and whether Wi-Fi, 4G or 5G.
- Reproduction steps, numbered, from a known starting state.
- Expected and actual behaviour, in separate sentences.
- Screenshots or a recording, especially for anything visual or timing dependent.
Consolidation is where most reports decay. Duplicate findings should merge into one defect with every reproduction attached, and severity should be graded against a published rubric so two testers don't rank the same crash differently. Keep execution and verification as separate responsibilities, and record a confidence level on each confirmed finding.
For the handoff side of reporting, this walkthrough is a useful companion to the fields above.
Aggregate pass rates are the most misleading number in a release report. A build at 96% pass can still be unsafe if all four failures sit on the budget Android tier that carries most of the install base. Show results per case per device, so concentration is visible instead of averaged away.
When you commission a report, ask for coverage tables, a device and browser matrix, session logs, and an explicit reason for every case that wasn't executed. A software testing report template that survives review is a fair structure to demand. Then enforce the fields: a defect without a device and a network doesn't enter the backlog, because it will come back.
Confirm Your Device Plan Before You Ship
Sign off when every matrix row has a result and no critical journey is blocked. Hold when any high-severity defect is unverified, or when any target went unrun without a stated reason.
Three checks make that rule concrete.
- Coverage: the matrix includes the budget Android tier, the oldest supported Android and iOS versions, and the desktop browsers your web app serves.
- Speed: the three retention-critical flows have p95 targets and recorded timestamps for each run.
- Journeys: the privacy and accessibility journeys ran on the planned devices, not on one convenient phone.
Starting is simpler than many teams assume. No call, scope document or device list is needed beyond something like budget Android, iPhone 11 or later, Chrome on Windows and Safari on Mac. The test plan builder covers Android, iOS and Web with 1 to 10 phones or browsers per platform, so the matrix can be priced before anyone commits to hardware.
The release decision isn't how many devices you tested. It's whether every target you chose produced a recorded result, and whether the journeys that matter ran on the devices your users actually hold.
When your matrix is written and you need it executed on the exact phones and browsers your users carry, 99tests runs your test cases on real Redmi, Samsung and iPhone hardware and on Chrome and Safari, then returns verified reports with coverage tables, device and browser matrices, and the reason behind every case that couldn't run. Send builds as an APK link, a Google Play internal testing link, a TestFlight link or a web URL, and the same plan can be rerun against your next build for a like-for-like comparison. Visit 99tests to price a matrix and turn your device plan into release evidence.